

Guide to Candlestick Patterns for Traders
📈 Learn key candlestick patterns to spot market shifts in shares, forex, and commodities. Boost your trading edge with clear signals relevant to South African markets.
Edited By
Sophie Reynolds
Candlestick patterns are a cornerstone of technical analysis, helping traders and investors make informed decisions. They visually represent price action within a specific time frame, showing the opening, closing, high, and low prices. For South African traders navigating local and global markets, a solid grasp of these patterns can uncover market sentiment and potential turning points.
Understanding these formations goes beyond memorising shapes. It involves interpreting what the price moves say about buyer and seller behaviours, momentum shifts, and market psychology. This practical insight is crucial when making quick calls on stocks listed on the JSE or forex pairs like USD/ZAR.
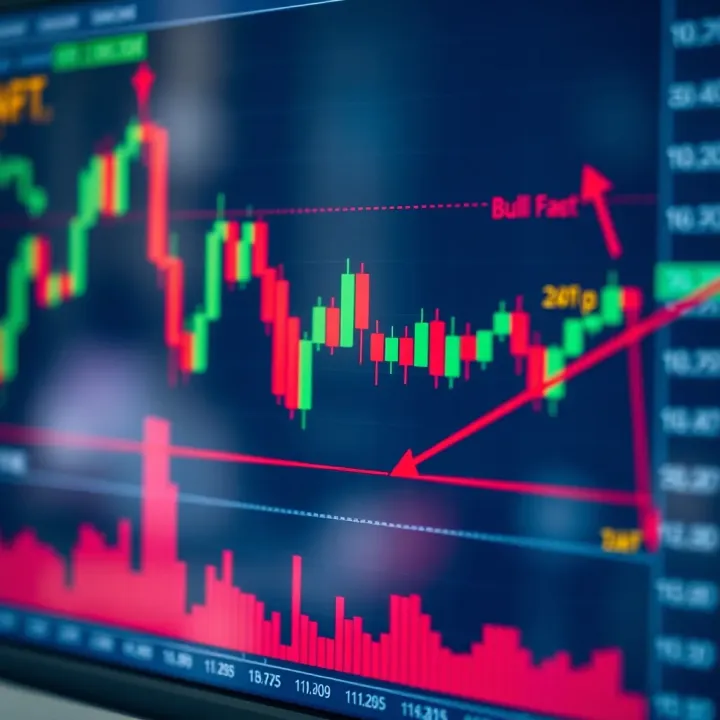
Candlestick charts provide a clear, immediate way to gauge market direction, especially when paired with volume and trend analysis.
The main categories to focus on include single candlestick patterns, such as the hammer and shooting star, which signal potential reversals, and multiple candlestick formations like the engulfing pattern or the morning star that indicate stronger shifts. Recognising these patterns helps with timing entries and exits effectively.
Many traders turn to downloadable PDF resources for easy reference and systematic learning. These PDFs consolidate patterns, typical behaviours, and example charts, making them handy during trading hours or for study sessions. In fact, simple annotated PDF charts can reinforce pattern recognition much faster than scrolling through endless online tutorials.
For those starting out, it’s wise to combine pattern recognition with local market context — consider how Eskom loadshedding or South African fiscal policies might affect volume and volatility. Incorporating this adds a layer of practical understanding rarely covered in generic guides.
In short, mastering candlestick patterns with the help of concise PDF guides can sharpen your chart reading skills and improve your trade outcomes. The next sections will methodically explore key patterns, their meanings, and approachable ways to integrate this knowledge in your trading strategy.
Candlestick patterns offer traders a quick glimpse of market dynamics, showing the battle between buyers and sellers at a glance. Understanding these patterns helps you read price action beyond mere numbers, giving insight into how traders across the globe react to events and conditions. This matters especially in volatile markets where quick decisions based on chart cues can make the difference between profit and loss.
Candlestick charts paint a picture of how an asset’s price moved over a particular period—be it minutes, hours, days, or weeks. For example, a daily candle bundles together all trades from one day, revealing the open, close, high and low prices. This visual summary helps traders identify trends, reversals, or indecision in that timeframe.
This form of charting is especially practical in South Africa’s fast-moving forex and local equities markets, where seeing the shape, colour, and size of candles offers immediate context. Imagine watching a Johannesburg Stock Exchange (JSE) stock: a long green candle signals strong buying throughout the day, whereas a small-bodied candle with long wicks indicates uncertainty or price tug-of-war.
Each candlestick is made up of four key points: open, close, high and low. The body, or ‘real body’, connects the open and close prices, with its colour showing whether closing price was higher (typically green or white) or lower (red or black) than the opening.
The lines above and below the body are called shadows or wicks. They capture the extremes reached within the timeframe. For instance, if the candle’s upper wick is long, it means buyers pushed the price up but sellers forced it down before close. These patterns often hint at potential shifts in momentum, which traders need to catch early.
Candlestick patterns act like mood rings for the market. They reflect collective trader sentiment at any moment—fear, greed, hesitation, or confidence. Take the hammer pattern: appearing after a downtrend, it shows buyers tried to push the price up strongly despite earlier selling pressure, hinting that sellers might be losing control.
Understanding these moods helps traders gauge when consumers or investors might step in or step back, aligning their strategies accordingly. A local commodity trader might spot a bullish engulfing pattern in platinum prices and decide it’s a good time to buy given rising industrial demand.
While no pattern guarantees future movement, candlestick arrangements tend to predict probable price shifts by signalling potential trend reversals or continuations. For example, the evening star pattern often signals a bearish reversal after an uptrend, alerting traders to tighten stop-losses or consider exits.
In practical terms, a forex trader watching USD/ZAR could spot these signals before others, allowing them to adjust positions and manage risk wisely. Combining candlestick analysis with volume and support/resistance levels commonly improves prediction accuracy.
Reading candlesticks isn’t about crystal-ball gazing, but about noting how price patterns reveal the push and pull of market players – vital knowledge for making informed trading moves.
By mastering the visual and interpretive language of candlestick charts, traders in South Africa can better navigate their markets, spotting opportunities and guarding against pitfalls with clearer insight.
Candlestick patterns fall broadly into categories based on the number of candles involved and the kind of signal they provide to traders. Knowing these categories helps you quickly identify what the pattern is trying to tell you about market sentiment and potential price direction. This section looks at both single and multiple candlestick patterns, explaining their practical use to sharpen your trading decisions.
A Doji is a unique single candlestick pattern characterized by its small or non-existent body, where the opening and closing prices are virtually the same. This shape indicates indecision among traders—neither buyers nor sellers are in firm control. For example, if a Doji appears after a strong bullish run, it might signal hesitation and a possible reversal or pause.
The practical value of recognising Dojis lies in their ability to warn of potential market turns or pullbacks. Spotting a Doji in your charts, especially around key support or resistance levels, can prompt you to tighten stop-loss orders or prepare for a possible change in trend.

Both the Hammer and Hanging Man share a similar shape: a small body with a long lower wick, but their meaning depends on the previous price action. A Hammer typically appears after a downtrend, suggesting a potential bullish reversal as buyers push prices back up after initial selling pressure. Conversely, the Hanging Man appears following an uptrend and can indicate a bearish reversal as sellers start to assert themselves.
Practically, these patterns alert you to shifts in momentum. For instance, encountering a Hammer on a daily chart of a JSE-listed stock after several red candles could mean the bears are losing strength. This insight helps in planning entries to catch early reversals or exit before sharp drops.
A Spinning Top features a small real body flanked by upper and lower shadows of similar length. This formation signals indecision or a tug-of-war between buyers and sellers. Unlike a Doji, a Spinning Top shows some price change but admits uncertainty.
In practice, spotting a Spinning Top during an uptrend or downtrend might mean the current move is losing steam. For example, if a Spinning Top appears after sustained price gains in a commodity like gold, it suggests traders should watch for signs of reversal or consolidation before making big calls.
Engulfing patterns consist of two candles where the second completely 'engulfs' the first, signalling a significant shift in market momentum. A Bullish Engulfing pattern happens when a large green candle follows a smaller red candle, hinting at buyers taking control. A Bearish Engulfing shows the opposite.
These patterns are useful because they often mark the start of strong trends. For instance, a Bullish Engulfing pattern in a blue-chip share listed on the JSE, following a brief decline, may encourage traders to buy in anticipation of a recovery.
These are three-candle formations that provide more reliable reversal signals. The Morning Star appears after a downtrend and suggests a bullish reversal, typically starting with a large red candle, followed by a smaller indecisive candle, then a big green candle sealing the shift. The Evening Star is the bearish counterpart.
The practical benefit is that these patterns combine more market data points, giving traders increased confidence in predicting trend changes. They can be especially handy in volatile markets, like forex pairs monitored by South African investors.
These patterns involve three consecutive candles moving strongly in one direction. Three White Soldiers consist of three large green candles with small shadows, signalling a strong bullish trend. The Three Black Crows—three big red candles—indicate a bearish downtrend.
Recognising these patterns helps traders identify sustained moves rather than short-term blips. For example, spotting Three White Soldiers in the platinum market could reinforce a buy decision, while seeing Three Black Crows in a retail sector share might prompt caution or selling.
Understanding these key candlestick pattern categories equips you to read charts more effectively and react confidently to market shifts. Whether trading stocks, forex, or commodities, distinguishing between single and multiple candle signals improves your timing and risk management.
Single candlestick patterns reveal valuable clues about market sentiment at specific points in time, often signalling potential reversals or pauses in trend momentum. Understanding these patterns arms traders and investors with quick insights that can complement broader analysis. Among them, Doji and the Hammer family stand out due to their unique ability to highlight moments when buyers and sellers struggle for control.
A Standard Doji forms when the opening and closing prices are nearly identical, creating a cross or plus-shaped candle. This shape reflects indecision among traders — neither buyers nor sellers managed to push prices decisively during the session. In practice, spotting a Doji after a sustained uptrend or downtrend can warn that the prevailing trend might be losing steam. For example, a Standard Doji at the top of a rising price could suggest hesitation, prompting traders to tighten stops or prepare for a possible reversal.
The Dragonfly Doji features a long lower shadow but a close and open price at or near the day's high. This means the price sharply dropped during the session but rallied back to finish near where it started. It often surfaces after falling price action and signals potential bullish reversal. In South African markets, seeing a Dragonfly Doji during local trading hours after a down move may suggest strength returning, and traders might expect upward movement in the sessions ahead.
On the flip side, the Gravestone Doji has a long upper shadow, with open and close prices near the low. This candle suggests an initial surge that sellers pushed back strongly, indicating growing selling pressure. Emerging after an uptrend, it could hint at bearish reversal or at least a pause in an advance. For example, a Gravestone Doji on a JSE stock chart may encourage cautious traders to consider profit-taking or at least watch for confirming signals before chasing further gains.
Both Hammer and Hanging Man candles share a small real body near the top end and a long lower wick, often twice the length of the body. The key difference lies in their market context. The Hammer typically appears after a downtrend, signalling buyers fought back after strong selling pressure during the session. The Hanging Man surfaces at the end of an uptrend, suggesting the bullish move may be faltering as sellers began to assert.
Context shapes how traders interpret these patterns. A Hammer near a support line or after loadshedding disruptions causing short-term falls could indicate a bounce-back opportunity. Meanwhile, a Hanging Man during overheated conditions — perhaps after news hype or speculative buying on a share like Sasol — may act as an early warning to exit or protect profits. Confirming signals, such as higher volume or follow-up candlesticks, help validate the signal before acting.
Recognising and correctly reading these individual candlestick patterns equips you to spot turning points early, improving decision-making amid volatile markets or quick moves common on local exchanges. Keeping a keen eye on these can save you from getting caught in fakeouts or missing rebounds.
Key takeaway: Learn to spot these patterns quickly, then combine them with other tools—like volume or trendlines—for more confident trading choices in Mzansi's dynamic market environment.
Multiple candlestick formations offer a richer insight into market dynamics than single patterns alone. They're crucial because they capture the interplay between buyers and sellers over several trading sessions, exposing shifts in momentum or possible reversals. South African traders often spot these patterns in charts for JSE stocks or forex pairs like the USD/ZAR, using them to time entries or exits more confidently.
Bullish engulfing occurs when a small red (bearish) candle is followed by a larger green (bullish) candle that completely covers the previous one. This shows an abrupt switch from selling to buying pressure, hinting that the bulls have taken control. For example, if Sasol shares drop for a day, then a strong bullish engulfing pattern forms next day, it might suggest a rally, especially if it appears near a support level.
Traders find this pattern valuable because it signals potential trend reversals early, allowing them to enter before momentum gathers speed. However, confirmation from volume spikes or other indicators tends to improve reliability.
Bearish engulfing is the opposite, where a smaller green candle is overtaken by a larger red candle, signalling sellers overpowering buyers. Imagine Naspers shares rising steadily, then a bearish engulfing pattern shows up; it could warn of a downturn ahead. This pattern often appears near resistance zones.
Recognising bearish engulfing helps traders limit losses by exiting long positions or even opening short trades. Still, it’s wise to combine it with other trend signals or broader market context for a clearer picture.
The Morning Star and Evening Star patterns involve three candles that together indicate strong reversals. A Morning Star starts with a long bearish candle, followed by a small-bodied candle (could be a Doji or Spinning Top) signalling indecision, and then a long bullish candle confirming a shift upward. This sequence is quite reliable and shows up in charts when markets change from downward to upward trends.
Conversely, the Evening Star signals a peak before a decline: a strong bull day, a brief pause or indecision, then a bearish candle closing lower. Both are used by traders on the JSE or forex charts to time when to buy or sell, often preceding notable price swings.
The Three White Soldiers pattern consists of three consecutive long green candles, each closing higher, with small or no wicks. This pattern shows sustained buying strength and often marks a strong bullish trend. For instance, a Mining ETF on the JSE might display this pattern over three days, indicating a strong uptrend.
On the other hand, the Three Black Crows pattern shows three consecutive long red candles, each closing lower, signalling persistent selling pressure and likely continuation of a downtrend. Recognising these patterns helps traders avoid chasing tops or bottoms recklessly.
Spotting these multiple candlestick formations equips traders with early clues on momentum shifts, boosting decision-making for entries, exits, or risk management in volatile markets.
Overall, understanding these patterns in the context of volume, market news, and support or resistance levels provides South African traders with practical advantages, whether in local shares, forex, or commodities trading.
In trading, having quick and reliable access to reference materials makes a big difference, especially when analysing candlestick patterns. PDF guides serve as handy tools that you can consult on the go, making it easier to keep track of the various formations and what they signal. For South African traders navigating volatile markets and fluctuating data costs, PDFs are a practical way to study patterns offline without burning through precious data bundles.
PDFs organise candlestick patterns clearly, often with charts, explanations, and examples all in one place. Instead of scrolling endlessly online, you simply open a file and find what you need at a glance. This immediacy is useful when analysing live market data where time is short. For example, spotting a hammer or an engulfing pattern in your local share portfolio becomes quicker when you don't have to hunt through multiple web pages.
The beauty of PDF guides is that they work offline — ideal for South Africans who might deal with unstable internet or prefer studying during commute times on their mobile devices. Whether you're on a datacapped plan or in a town with patchy coverage, saving PDFs to your phone or tablet means uninterrupted access. This flexibility helps you turn spare moments into valuable learning opportunities.
Look for PDFs from reputable sources like established financial education sites, local trading academies, or well-known brokers who offer free downloadable materials. Websites catering specifically to South African traders might also tailor examples and market data to the local context. Avoid random downloads from unknown sites since these could be outdated or inaccurate.
Before relying on any PDF, double-check the date of publication and author credentials. Recent guides better reflect current market behaviour and include up-to-date terminology. Cross-reference the included patterns with trusted textbooks or South African financial news portals, such as MyBroadband or BusinessTech. Be cautious about PDFs promising “secret patterns” or unrealistic profits—they often lack sound analysis.
Use PDF readers that let you highlight or annotate directly on the document. Marking important patterns or jotting quick notes beside explanations helps fix these concepts in your mind. For instance, when practising chart reading, you might highlight all bearish reversal patterns to focus your analysis on potential exit signals.
Summarise key candlestick patterns from PDFs into your own cheatsheet, concentrating on the patterns you encounter most in South African markets or your chosen assets. Keep this cheatsheet handy for rapid review before trading sessions or when monitoring your investments. It doesn’t have to be long—just enough to refresh your memory and improve decision-making.
Having well-organised, reliable PDF resources is like carrying a mini trading mentor wherever you go. Especially in markets affected by factors like loadshedding, data limits, or erratic internet, these guides keep your learning on track without the fuss.
In short, investing time in finding and using quality candlestick PDFs can sharpen your trading skills, boost confidence, and ultimately support smarter decisions on the JSE or other South African instruments.
📈 Learn key candlestick patterns to spot market shifts in shares, forex, and commodities. Boost your trading edge with clear signals relevant to South African markets.

📊 Master advanced candlestick patterns to read price moves smarter! Understand formations, signals, and use them to sharpen your trading decisions in any market.

Learn to spot high profit candlestick patterns📈 with this practical guide. Understand trader psychology🧠 and access helpful PDF resources📄 for smarter decisions.
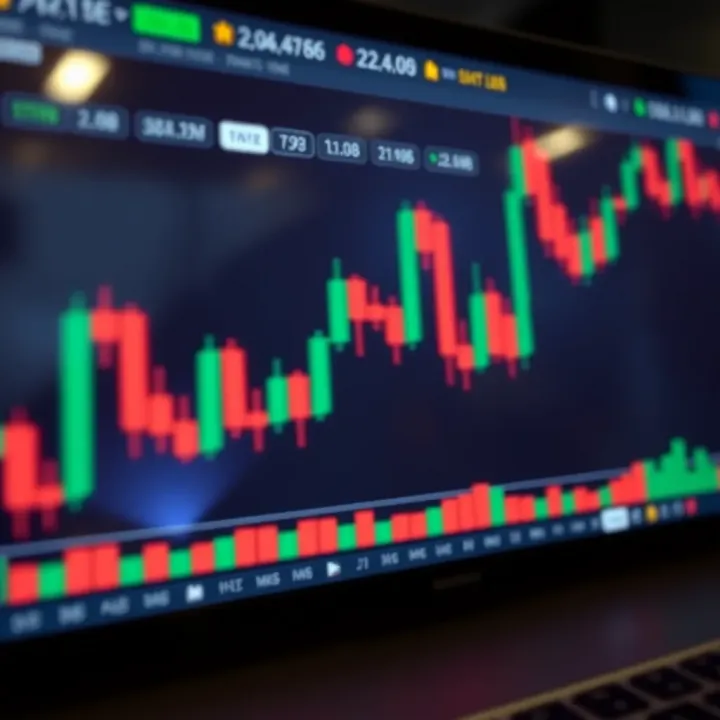
📈 Master key candlestick patterns in forex trading with this practical guide. Learn to identify formations, apply strategies, and manage risk confidently in real markets.
Based on 15 reviews