

Understanding Forex Trading Sessions
📈 Learn about forex trading sessions, their timing, key traits, and tips to use session info and PDFs effectively for smarter trading decisions.
Edited By
Michael Davies
Candlestick patterns are essential tools for traders looking to understand market mood swings and price trends in forex trading. Originating in Japan centuries ago, these charts visually depict price movements within set time frames, helping traders spot potential reversals or trend continuations.
Understanding these patterns is not just about recognising shapes on a chart. It's about reading the market sentiment behind those shapes—whether buyers or sellers are taking charge, and what that could mean in the next few minutes, hours, or days.
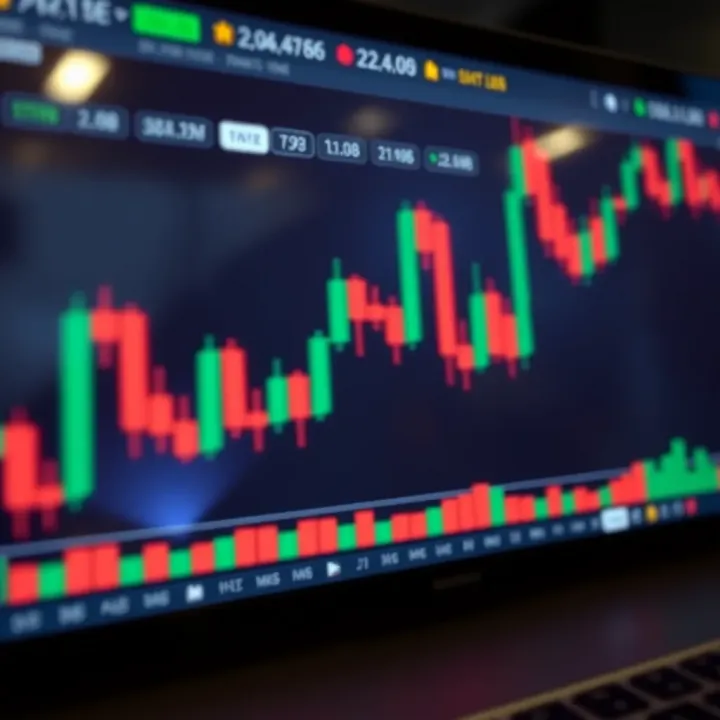
Unlike simple line charts, candlesticks offer a compact summary of four key data points: the opening, closing, high, and low prices within a specific period. This gives traders richer details to make decisions, especially in the fast-moving forex market.
Candlestick patterns serve as visual signals for shifts in market momentum, making them invaluable for timing entries and exits.
The “body” shows the open and close prices.
The “wick” or “shadow” represents the high and low prices.
A filled or coloured body means the price closed lower than it opened; a hollow or green body means it closed higher.
For example, the Hammer pattern, which forms after a downtrend with a small body and long lower wick, often hints at a potential bullish reversal. A trader noticing this might consider buying, but most won’t act on the pattern alone—they’d wait for confirmation, like a higher close on the next candle.
Experienced traders often combine candlestick signals with other tools like support and resistance levels, moving averages, or momentum indicators to reduce false signals.
No pattern guarantees success. Using stop-loss orders just below the wick lows (for bullish patterns) or above highs (for bearish) limits losses when the market doesn’t cooperate. This discipline keeps trading sustainable.
As this guide unfolds, you'll explore key single and multi-candle patterns, how to integrate them into your setups, and where to find trustworthy resources tailored to South African forex traders.
In short, mastering candlestick reading enhances your edge, but practical strategy and risk control remain your anchors.
Candlestick charts form the backbone of many forex traders’ technical analysis. They offer a clear window into price action, making it easier to spot potential trends and reversals. Unlike plain line charts, candlesticks show detailed price information for a specific time frame: opening, closing, highest, and lowest prices. This makes them especially valuable when trading volatile forex pairs, where quick insights can guide timely decisions.
At first glance, a candlestick looks simple but it communicates a lot. The body represents the price range between the opening and closing levels within the chosen period. If the body is filled or shaded, it usually signals the close was lower than the open — indicating selling pressure. A hollow or unfilled body means the close was higher, hinting at buying strength.
Attached to the body are thin lines on either end called wicks or shadows. The upper wick shows the highest price reached during that time, while the lower wick reveals the lowest point. Long wicks signal rejection of price levels; for example, a long upper wick could mean sellers pushed prices down after a rally, warning of a possible reversal.
Bullish candles occur when the closing price beats the opening price, typically displayed with a lighter or hollow body. This suggests buyers controlled the market during that interval. Consider a currency like the USD/ZAR: a bullish candlestick after a drop might hint the rand is weakening while the dollar gains strength.
In contrast, bearish candles close below the opening price and usually show with a filled or darker body. This indicates selling dominance. Traders often track the ratio of bullish to bearish candles to gauge short-term market sentiment. Spotting clusters of bearish candles after an uptrend could signal a shift toward selling pressure — a prompt to tighten stop-losses or take profits.
Candlesticks bring more visual clarity than line or bar charts. While line charts merely connect closing prices, candlesticks display open, high, low, and close, all in one glance. This layered view allows traders to assess strength and momentum quickly. For instance, spotting a series of small-bodied candles with long wicks might suggest indecision, advising caution.
Traders often say a single candlestick can tell a story about market sentiment, something a simple line cannot.
More importantly, these charts capture market sentiment in real time. Forex markets react swiftly to news or data releases, and candlesticks reflect this immediately. An unexpected interest rate change from the South African Reserve Bank (SARB), for example, might trigger rapid shifts visible as sudden large bodies or long wicks on the charts.
This immediacy helps traders adjust positions faster, manage risk better, and align strategies with evolving conditions. Candlestick charts offer a direct look at the tug of war between buyers and sellers — a core insight for anyone serious about forex trading.

Recognising key candlestick patterns is fundamental for traders aiming to get a grip on market sentiment and potential price moves. These patterns provide visual cues that hint at whether buyers or sellers hold the upper hand. In forex trading, where timing is everything, knowing these patterns can mean the difference between a smart entry and a misplaced bet. Let’s walk through the most important ones, starting with single-candlestick formations and then moving on to multi-candle patterns.
A Doji happens when a candle’s opening and closing prices are basically the same, showing indecision in the market. Imagine a tug of war where neither side manages to pull the rope in their favour — that’s what a Doji signals. In practical terms, it often appears before a reversal or a pause in the current trend. For example, on a strong uptrend, a Doji candle might warn that buyers are losing steam and a pullback could be near.
These two look almost identical but tell different stories depending on where they’re found on the chart. A Hammer shows a small body near the top with a long lower wick and usually signals a potential bullish reversal after a downtrend. Picture a bakkie skidding but managing to stop just before the donga — it’s a sign buyers are stepping back in. Meanwhile, a Hanging Man appears after an uptrend and warns that sellers are pressing hard; it can be a caution to take profits or tighten stops.
Both feature a small body with a long upper wick, but their implications depend on context. A Shooting Star at the top of an uptrend points to a possible reversal downward — sellers challenged buyers but won out eventually. Conversely, an Inverted Hammer after a decline suggests buyers might be mounting a comeback, hinting at a bullish reversal soonish. Traders watch these candles closely for confirmation in the following bars.
Engulfing patterns involve two candles where the second fully covers the first body. A Bullish Engulfing appears after a downtrend and signals buyers taking charge — it’s like a small wave becoming a tidal surge. Likewise, a Bearish Engulfing after an uptrend forewarns sellers gaining dominance. These patterns help confirm trend changes but work best when combined with support or resistance zones.
The Harami (Japanese for "pregnant") is a two-candle pattern signalling indecision. The second candle fits entirely within the first candle’s body, showing hesitation from market participants. A Bullish Harami can suggest a pause or reversal after a fall, while a Bearish Harami might show potential weakness after a rise. Traders often wait for confirmation in the next candle before acting.
These three-candle patterns signal strong trend reversals. The Morning Star starts with a bearish candle, followed by a small-bodied candle that gaps down or appears indecisive, then a bullish candle closing well into the first candle’s body. It suggests buyers are gathering momentum. The Evening Star is its opposite — signalling a bearish turn after a bull run. Spotting these can help you anticipate shifts before big price moves.
The Three White Soldiers are three consecutive strong bullish candles with each candle closing higher than the last. This pattern shows solid buying pressure and often confirms the start of an uptrend. On the flip side, the Three Black Crows are three consecutive bearish candles closing lower each time, indicating sellers taking control. Both patterns give traders confidence in the direction of the market when they appear at the right place.
Recognising and understanding these candlestick patterns helps traders read the market’s 'mood' clearly and make better decisions. Coupled with context like support levels or indicators, these patterns can significantly improve your forex trading edge.
Candlestick patterns are more than just shapes on a chart—they offer practical clues about market sentiment and potential price moves. But relying solely on these patterns without context can lead to missteps. That’s why integrating them with other analytical tools is key for any serious forex trader wanting to sharpen their edge. Combining candlestick setups with support and resistance levels and technical indicators offers clearer signals for entry, exit, and managing risk.
Support and resistance levels act like the market’s natural barriers—prices often stall or reverse when hitting these zones. When a bullish reversal candlestick, such as a hammer, forms at a strong support level, this combination strengthens the case to buy. Likewise, a bearish engulfing candle appearing at resistance suggests a potential exit or short opportunity. These confirmations help you pick moments with higher probability that the market will move as expected.
For example, say the EUR/USD pair has found support around 17.5000 repeatedly. Spotting a bullish engulfing candle there provides more confidence to enter a long trade, compared to the same pattern popping up mid-trend with no nearby support. Properly combining candlestick signals with these price barriers reduces guesswork.
Not every candlestick pattern plays out; sometimes they give false hope. Integrating support and resistance helps weed out many of these misleading signals. If a bearish pattern emerges far from any meaningful resistance, the chances of a sharp reversal drop. Traders who ignore this often fall prey to traps, entering trades only to see the price continue against them.
Plus, small, random candles during sideways markets can look like patterns but mean little. Verifying these patterns against key support or resistance levels filters choppy price action noise. It’s a safeguard against chasing the market blindly.
Moving averages smooth out price movement and highlight trend direction. When a bullish candlestick pattern appears above a key moving average—say the 50-day simple moving average (SMA)—it suggests strength in the trend. For instance, a morning star pattern just above the 50-day SMA on GBP/ZAR confirms buyers are returning after a pullback.
Conversely, bearish patterns below major moving averages signal potential further drops. Using moving averages alongside candlestick patterns helps confirm whether a signal aligns with overall momentum or stands alone as a weak cue.
RSI measures overbought and oversold market conditions, ranging between 0 and 100. When a reversal candlestick develops in oversold territory (RSI below 30), the likelihood of a bounce increases. For example, if USD/ZAR shows a hammer candle while RSI signals oversold, traders can expect a probable short-term rally.
On the flip side, bearish patterns appearing when RSI is above 70 (overbought) warn of a possible downturn. RSI adds context to candlestick setups by flagging whether prices are stretched or balanced, improving timing.
The Moving Average Convergence Divergence (MACD) indicator tracks momentum shifts via the interaction of fast and slow moving averages. When a bullish candlestick pattern aligns with a MACD line crossing above its signal line, it confirms upward momentum building.
Similarly, bearish candlesticks occurring around a MACD crossover down indicate strengthening selling pressure. Combining MACD signals with candlestick patterns reduces false alarms and improves precision on trade entries.
Used thoughtfully, these combinations act like a traffic light system—candlestick patterns give you a signal, support/resistance confirms the road, and indicators tell you if it’s safe to go.
This approach helps South African forex traders navigate volatile pairs, from USD/ZAR to EUR/USD, with practical awareness and better-informed decisions.
When trading forex using candlestick patterns, practical application is where theory meets reality. Recognising the patterns isn’t enough; you need solid habits to protect your capital and maximise opportunities. This section helps you sharpen those skills, focusing on managing risk and steering clear of typical pitfalls.
Setting stop-loss orders is a cornerstone of sensible trading. This tool acts as your safety net, automatically closing a trade if the market moves against you beyond a certain point. For example, if you enter a long position on EUR/USD after spotting a bullish engulfing pattern near a support level, placing a stop-loss just below the support can limit losses if the trend reverses unexpectedly. Not setting a stop-loss leaves you exposed to significant losses during sudden market swings or unexpected events, which happen frequently in forex.
Calculating appropriate trade size is just as vital. Even with a sound strategy, risking too much on a single trade can quickly erode your trading account. The common rule is to risk no more than 1-2% of your capital per trade. Suppose you have R50,000 in your trading account and decide to risk 1%. Your maximum loss would be R500 on any given trade. Based on the distance between your entry point and stop-loss level, you can calculate the lot size to match that risk. This keeps your trades proportionate to your account and preserves your ability to stay in the game longer.
Ignoring the broader market context is a trap many new traders fall into. A strong candlestick pattern alone doesn’t guarantee a profitable trade if the wider market trend contradicts it. For instance, spotting a hammer (a bullish reversal signal) during a clear downtrend requires extra caution. Confirming this with longer-term charts or key economic news can prevent entering trades that go against the predominant market direction. Remember, the market is like a taxi rank; you want to jump into a bakkie heading your way, not one going the opposite direction.
Overreliance on single patterns can also lead to poor results. Candlestick patterns are powerful but work best alongside other tools like support and resistance, volume, or indicators like the RSI. For example, a doji might suggest market indecision, but on its own, it doesn’t confirm a trend change. Combining it with oversold RSI levels or approaching a major support zone provides more reliable signals. Relying solely on a single candle can lead to chasing false signals and unnecessary losses.
Good traders treat candlestick patterns as clues, not crystal balls. Knowing when to act and how to protect your trades make all the difference.
Using candlestick patterns thoughtfully—by managing risk carefully and reading the bigger picture—helps you avoid common traps and trade forex more confidently.
Finding good learning resources is key to mastering candlestick patterns in forex. PDFs can be especially handy since they’re easy to download, annotate, and refer back to when you need a refresher. The right materials help cut through the noise and focus on patterns that actually work in active markets.
When picking a candlestick pattern PDF, look for up-to-date content written by experienced traders or analysts who understand the nuances of forex markets. It helps if the PDF explains each pattern clearly, shows real examples from historical charts, and includes guidance on how to apply these patterns in different market conditions. Avoid overly technical PDFs that confuse rather than clarify.
Try to find PDFs that are straightforward, well-structured, and include practical tips on risk management alongside pattern recognition. Some free PDFs might be basic, so if you’re serious about improving, investing in a well-regarded paid PDF or eBook can pay off by offering deeper insights and additional tools.
Good sources for reliable PDFs include respected financial education sites, major trading platforms, and forex brokers that provide educational materials. Examples are official analysis reports from companies like IG, Saxo Bank, or websites like BabyPips. These often feature downloadable guides designed with real traders in mind.
South African traders benefit from active online communities and forums where you can discuss candlestick patterns with peers. Platforms like the Forex South Africa Facebook group or the MyBroadband trading forum offer spaces where experienced traders share PDFs, tips, and local market insights — often including experiences specific to Mzansi’s market conditions such as local ZAR volatility and Eskom loadshedding impacts.
Local brokers such as Standard Bank Online Trading or EasyEquities sometimes offer their own educational resources tailored for South African traders. These often include video tutorials, webinars, and downloadable PDFs explaining candlestick patterns in a way that relates directly to the challenges and quirks of trading currency pairs in this region. Using such material means you get contextually relevant advice, including practical considerations like how to read local economic indicators and their effect on forex prices.
Investing time to find the right candlestick resources supports better-decision making and can save you from costly mistakes. Whether free or paid, ideally, your learning aids should balance theory with practical examples tailored to your trading environment.
📈 Learn about forex trading sessions, their timing, key traits, and tips to use session info and PDFs effectively for smarter trading decisions.
📊 Understand margin in forex trading: how much money you need to open and maintain positions, manage risks, and spot opportunities effectively.

Discover how to engage in halal forex trading 💹 by learning its key principles, challenges, and Shariah-compliant platforms. Tips for South African Muslims included.
📊 Understand forex trading signals in South Africa. Learn types, reliability, tools, and tips to use signals wisely in your trading strategy today.
Based on 12 reviews